Find the story in your data.

AI-assisted • Human-directed • Evidence-grounded

ChattyCHARTS is your Data Storytelling Studio. Explore charts, tables and notes with Chatty, uncover meaningful insights, and turn your findings into actions and stories that support better decisions.

Apply for private early access Applications reviewed personally.
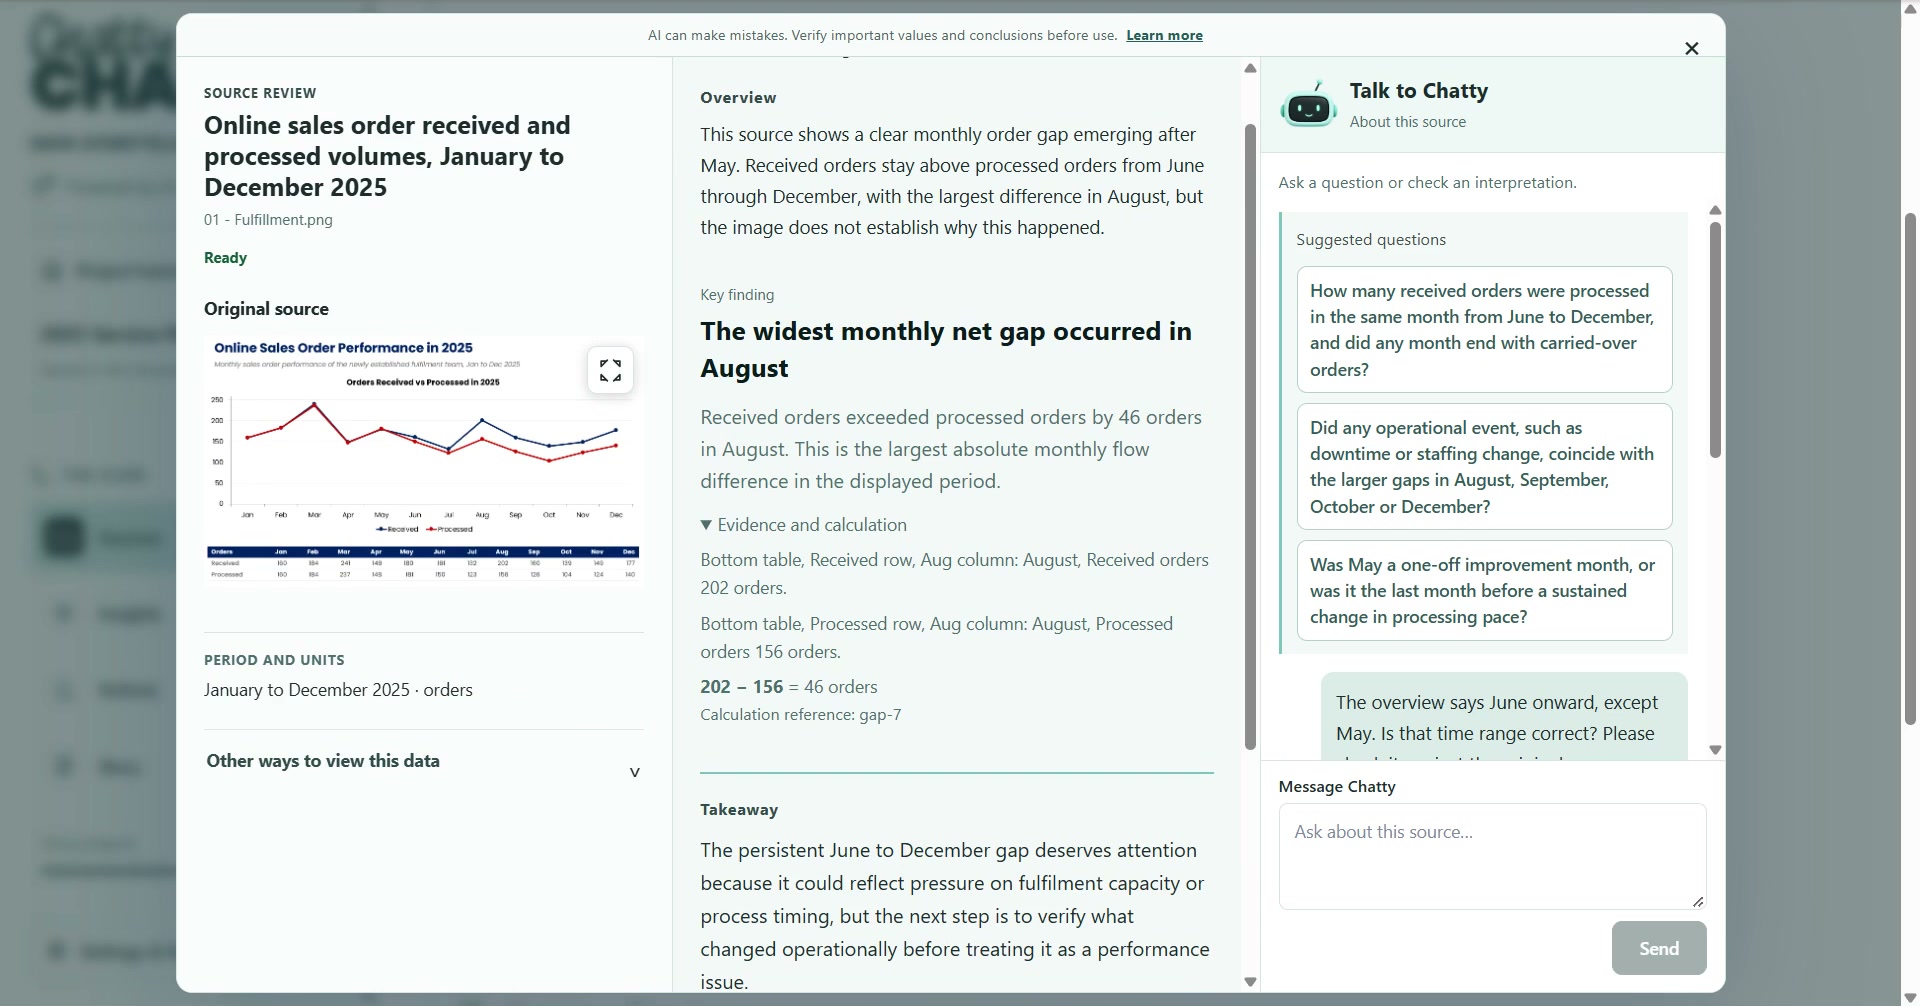
ChattyCHARTS source review showing the original chart, findings, calculations and Chatty conversation

Our principles

Better stories begin
with better thinking.

Focus on the Insight

Go beyond reporting numbers. Identify the key finding and explain why it matters.

Build a Clear Narrative

Organise the findings into a logical flow that connects what happened, why it matters, and what comes next.

Drive to Action

End with clear implications, recommendations, or next steps so the data leads to a decision.

From data to story

Find the meaning.
Make your point.

Sources

Your story starts with what you already have.

  • Bring your sources together. Start with tables, charts, screenshots and notes.
  • Keep the context. Explore the numbers alongside the information that explains them.
  • Stay close to the evidence. Keep the original source in view as your story develops.
Findings

See what deserves a closer look.

  • Spot what stands out. Explore changes, gaps and patterns in your data.
  • Find your focus. Identify the findings that matter for your question.
  • See the evidence. Check each finding against the source behind it.
Explore with Chatty

Your next question could reveal the story.

  • Ask naturally. Discuss your data in plain language.
  • Follow the finding. Explore what stands out and what it could mean.
  • Go deeper. Consider possible explanations and the evidence needed to check them.
Charts

Make the pattern easier to see.

  • Explore suggested charts. See visual options when your source supports them.
  • Bring the comparison into focus. Use a chart to help explain your finding.
  • Check the details. Review values, labels and context before sharing.
Insights

Get to the meaning behind the numbers.

  • Explore the why. Consider possible causes without treating them as proven.
  • Think ahead. Explore what could follow and why it might matter.
  • Know what needs checking. Keep supported facts separate from open questions.
Actions

Turn understanding into a next step.

  • Consider your response. Explore practical actions that fit the evidence.
  • Choose what needs attention. Decide what to act on, monitor or investigate.
  • Make the next step clear. Connect your recommendation to the finding behind it.
Story

Give your findings a story worth sharing.

  • Find your message. Bring the most important insight into focus.
  • Connect the evidence. Shape your findings into a clear written narrative.
  • Plan the presentation. Organise the messages and flow for your audience in-app.
Prepare for questions

Be ready for the conversation that follows.

  • See other perspectives. Consider what different stakeholders may care about.
  • Anticipate the questions. Explore where your audience might challenge your story.
  • Prepare your response. Build answers and identify the evidence you need to support them.

How the Studio Works

AI-assisted.
Human-directed.
Evidence-grounded.

ChattyCHARTS helps you analyse, question and shape the story, while you remain in control of the judgement and the evidence.

AI-assisted

Use AI to surface patterns, explore questions, develop insights and shape the story faster.

Human-directed

You decide what matters, add business context, challenge the analysis and approve the final message.

Evidence-grounded

Keep findings, calculations and conclusions connected to the source, with uncertainty made visible.

Review and amend to suit your needs. Verify important values and conclusions before sharing or acting.

Build a story you can stand behind.

FAQ

Your questions, answered.

Who is ChattyCHARTS for?

People who turn data into reports, management updates, presentations and decision discussions.

What sources can I use?

Charts, tables, readable screenshots of data, and relevant notes. The Studio shows the available upload formats.

Can it generate charts?

Yes, when your source supports them. Explore suggested charts, then check their values, labels and context.

Can I use company information?

Use only material you are authorised to upload, follow your organisation’s policies, and check the Studio’s privacy guidance.

How does Early Access work?

Apply with your intended use. Applications are reviewed personally, and selected applicants receive an invitation to activate access.

Private early access

What story do you want to find from your data?

Bring your data. Discover what matters. Build a story worth sharing.
  1. 1Tell us how you want to use ChattyCHARTS.
  2. 2If selected, receive a personal invitation.
  3. 3Activate your access and explore your data.
Applications are reviewed. Applying does not guarantee access.

Activate your invitation within seven days of its creation. Access lasts 30 days from activation on the same browser and device.

Try a relevant task and share honest feedback. Testimonials and public posts are optional.

How often do you use data to prepare reports, updates, analyses or presentations?
Could you test ChattyCHARTS AI within 7 days of receiving access?
Would you be willing to join a short 20-minute follow-up conversation after testing?

Application privacy. We collect the details above only to assess and operate Private Early Access, contact selected applicants, prevent basic abuse and understand campaign source. Do not submit source files, confidential work data or restricted personal information. Application records are kept separate from product projects and normal product analytics.

Submitting does not create an account or grant product access.